Image Details
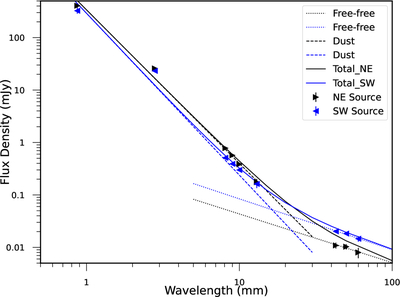
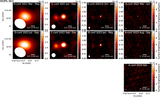
Caption: Figure 15.
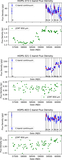
Submillimeter to radio spectrum of the NE and SW components of HOPS 373. The dotted lines represent free–free emission fitted to only the three longest wavelength points, and dashed lines represent dust emission. The individual flux density measurements corresponding to the points are given in Table 7. The total spectrum for the NE component clearly overshoots at the longest wavelengths, resulting from the shallower slope of the shorter wavelength data.
Other Images in This Article
Show More
Copyright and Terms & Conditions
© 2026. The Author(s). Published by the American Astronomical Society.
Copyright ©
2026 Astronomy Image Explorer. All Rights Reserved.