Image Details
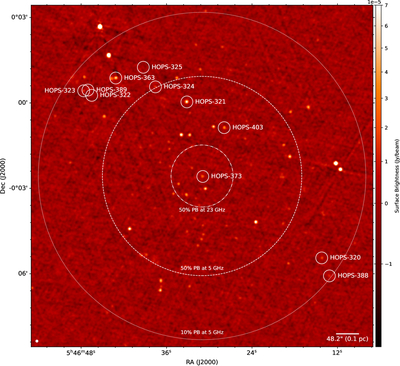
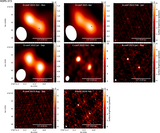
Caption: Figure 1.
Overview of the region around HOPS 373 as viewed at 5 cm by the VLA in the C configuration. This image is a combination of all C-configuration data, providing a good compromise between resolution and feature size for an overview of the region. The 5 cm 50% and 10% power points of the primary beam are marked with dashed and dotted circles, respectively. The inner dotted–dashed circle delineates the 50% power point of the 1.3 cm primary beam. All HOPS sources within the 10% power point of the primary beam are labeled. The rms noise in this map is 1.2 μJy, and the beam size is 4﹩\mathop{.}\limits{^{\prime\prime} }﹩9. This is a “flat noise” image where the response of the primary beam has not been corrected.
Other Images in This Article
Show More
Copyright and Terms & Conditions
© 2026. The Author(s). Published by the American Astronomical Society.