Image Details
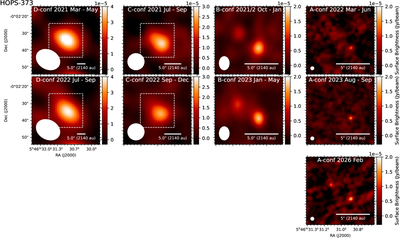
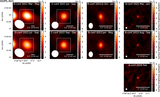
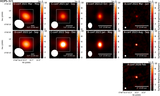
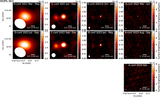
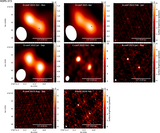
Caption: Figure 2.
Images of HOPS 373 from the VLA at 5 cm generated using all the data taken in a particular configuration. We show the D configuration (left), C configuration (left-middle), B configuration (right-middle), and A configuration (right). The images from the first pass through the VLA configurations are shown in the top row, the second pass through is shown in the middle row, and the final observation is shown in the bottom row. The time ranges for the observations included are annotated in each panel. The dotted boxes shown in the D- and C-configuration images denote the area zoomed-in on in the images shown from the higher-resolution configurations. The beams are drawn in the lower left corner, and a 5﹩\mathop{.}\limits{^{\prime\prime} }﹩0 scale bar is drawn in each panel.
Other Images in This Article
Show More
Copyright and Terms & Conditions
© 2026. The Author(s). Published by the American Astronomical Society.