Image Details
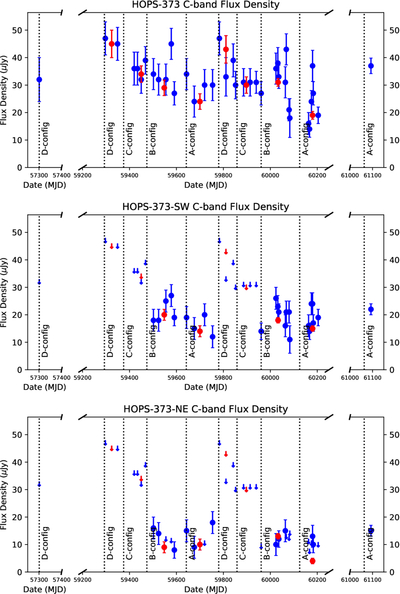
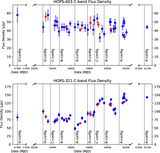
Caption: Figure 3.
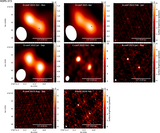
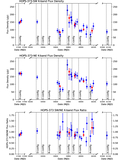
Flux density measurements for HOPS 373 (total flux), HOPS 373SW, and HOPS 373NE from all the epochs of observation. The blue points are measured from the individual observations, while the red points are measured using an image generated for all the data in a particular configuration. HOPS 373 shows a slight decline in flux density, which occurs with observations in higher-resolution configurations; as such, we do not think there is evidence for significant variation in its 5 cm flux density. The SW and NE flux densities are all upper limits for the D and C configurations because they are not resolved from each other, and we simply use the total flux density of HOPS 373 as an upper limit. Even the final monitoring point in 2026 February is consistent with the last measurements in 2023.
Other Images in This Article
Show More
Copyright and Terms & Conditions
© 2026. The Author(s). Published by the American Astronomical Society.