Image Details
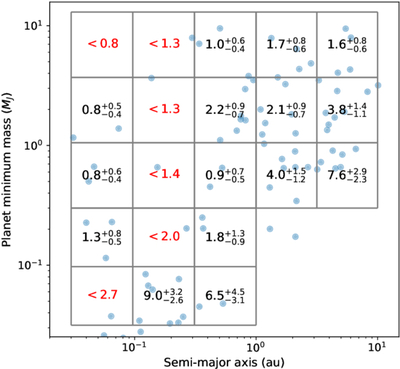
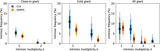
Caption: Figure 4.
This figure shows in blue dots the planets detected in the less biased CLS sample whose properties fall within our chosen parameter space. The values shown in the grid and their meanings are the same as described in the caption of Figure 2.
Other Images in This Article
Copyright and Terms & Conditions
© 2026. The Author(s). Published by the American Astronomical Society.
Copyright ©
2026 Astronomy Image Explorer. All Rights Reserved.