Image Details
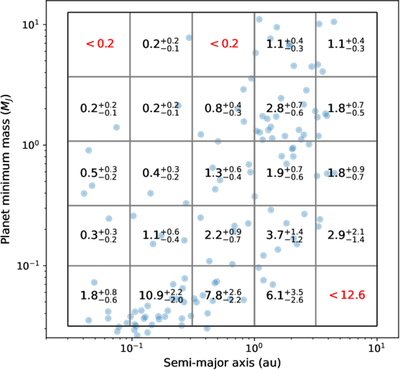
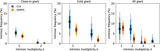
Caption: Figure 2.
This figure shows in blue dots the planets detected in the HARPS sample whose properties fall within our chosen parameter space. The values within each grid cell give the number of such planets per 100 stars. Error bars correspond to the 68% confidence interval, whereas for grid cells with fewer than two planets, only the 95% upper limit is shown. The integrated planet frequencies are ﹩{\bar{n}}_{{\rm{p}}}=0.036,\approx 0.104,\approx 0.140﹩ for our definitions of close-in, cold, and all giant planets, respectively.
Other Images in This Article
Copyright and Terms & Conditions
© 2026. The Author(s). Published by the American Astronomical Society.
Copyright ©
2026 Astronomy Image Explorer. All Rights Reserved.