Image Details
Caption: Figure 1.
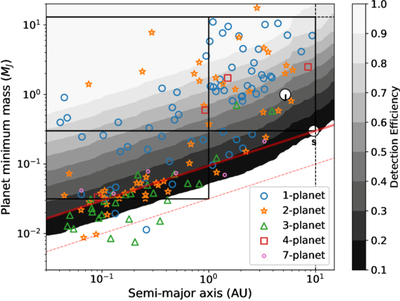
The distribution of 822 HARPS sample stars in the minimum mass versus semimajor axis plane. Planets with different observed multiplicities are differentiated with different labels and colors. The contours represent the survey completeness, with lighter shades indicating higher sensitivity and darker shades indicating lower sensitivity. Both are based on the data from M. Mayor et al. (2011). The vertical dashed line indicates the outer boundary (10 au) that is considered in this work, and the horizontal dashed line indicates the upper mass limit (13 MJ). The positions of Jupiter and Saturn are also shown. The regions of different planet categories defined in Section 3 are outlined by the black boxes. The red solid and dashed lines denote the RV semiamplitudes of 3 and 1 m s−1, respectively.
Other Images in This Article
Copyright and Terms & Conditions
© 2026. The Author(s). Published by the American Astronomical Society.