Image Details
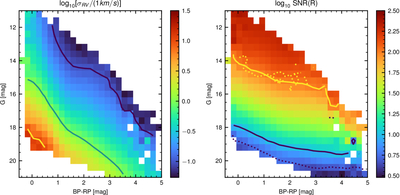
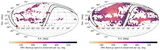
Caption: Figure 9.
Left panel: Formal radial velocity uncertainties as a function of Gaia G magnitude and (BP − RP) color. The colorbar shows ﹩{{\rm{log}}}_{10}({\sigma }_{RV}/[1\,{\rm{km}}\,{{\rm{s}}}^{-1}]),﹩ and lines show contours of constant radial velocity uncertainty of 0.1,1 and 10 km s−1 (dark blue, light blue, and yellow respectively). Right panel: Median SNR per pixel in the R-arm of the spectrograph as a function of Gaia color and magnitude. The solid lines show contours corresponding to SNR = 10 (blue) and SNR = 100 (yellow). The dotted lines show the same SNR contours but for the bright-time MWS.
Other Images in This Article
Show More
Copyright and Terms & Conditions
© 2026. The Author(s). Published by the American Astronomical Society.