Image Details
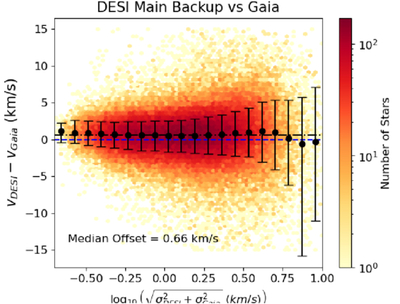
Caption: Figure 10.
Comparison between MWBP and Gaia radial velocity measurements for ≈105 stars from the DESI DR2 release with >20σ Gaia RVS measurements. The blue dashed line shows δ(v) ≡ vDESI − vGaia = 0, and the black points show the median value of the offset in bins of total error. The vertical bars show the range between the 16th and 84th percentiles. The dashed black line shows the median value of 0.66 km s−1, which represents the overall systematic offset between the DESI DR2 and Gaia radial velocity values.
Other Images in This Article
Show More
Copyright and Terms & Conditions
© 2026. The Author(s). Published by the American Astronomical Society.
Copyright ©
2026 Astronomy Image Explorer. All Rights Reserved.