Image Details
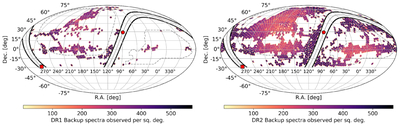
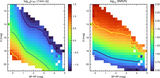
Caption: Figure 8.
The sky density and distribution of MWBP spectra in the DESI DR1 dataset (left) and the future DR2 dataset (right). The gray dashed line shows the slightly smaller footprint covered by MWS. The Galactic center and anticenter are marked by a red square and circle, respectively, and the solid black lines represent the MWBP Galactic latitude limit of ∣b∣ = 7∘.
Other Images in This Article
Show More
Copyright and Terms & Conditions
© 2026. The Author(s). Published by the American Astronomical Society.
Copyright ©
2026 Astronomy Image Explorer. All Rights Reserved.