Image Details
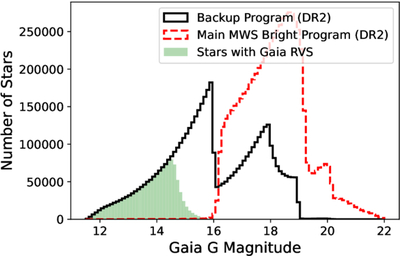
Caption: Figure 2.
The Gaia G-band magnitude distributions of the spectroscopically observed targets in the MWBP (black histogram) and the MWS (red dashed histogram). The subset of stars with radial velocity measurements from Gaia Radial Velocity Spectrometer are shown by the shaded green histogram. The DESI histograms are constructed from the targets observed during (approximately) the first three years of survey operations and which will be included in the second DESI Data Release (DR2).
Other Images in This Article
Show More
Copyright and Terms & Conditions
© 2026. The Author(s). Published by the American Astronomical Society.
Copyright ©
2026 Astronomy Image Explorer. All Rights Reserved.