Image Details
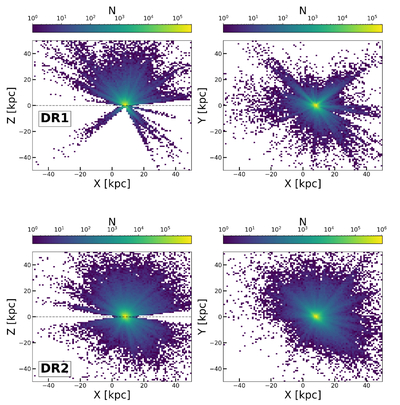
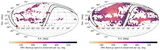
Caption: Figure 14.
The projection of spectroscopically observed MWBP targets in Galactocentric coordinates (X, Y, Z) of the MWBP based on distances from the SpecDis Catalog (S. Li et al. 2025), color coded by number density of spectra. The top and bottom panels show the density distribution of stars for the DESI DR1 and DR2 data releases, respectively, which represent ≈12% (DR1) and nearly 50% (DR2) of the total MWBP footprint (see left panel of Figure 8).
Other Images in This Article
Show More
Copyright and Terms & Conditions
© 2026. The Author(s). Published by the American Astronomical Society.
Copyright ©
2026 Astronomy Image Explorer. All Rights Reserved.