Image Details
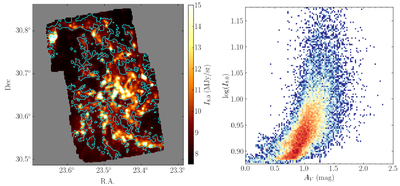
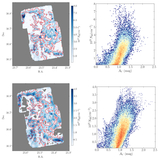
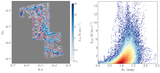
Caption: Figure 4.
Comparison between the extinction map constructed in this work and the Spitzer/IRAC 8 μm emission distribution. Left panel: Spitzer/IRAC 8 μm map at 12″ resolution, with cyan contours showing the mean AV derived in this work. Right panel: pixel-by-pixel comparison, shown as a density plot of AV versus ﹩{\rm{log}}({I}_{8.0}﹩), with colors from red to blue indicating high to low point density.
Other Images in This Article
Copyright and Terms & Conditions
© 2026. The Author(s). Published by the American Astronomical Society.
Copyright ©
2026 Astronomy Image Explorer. All Rights Reserved.