Image Details
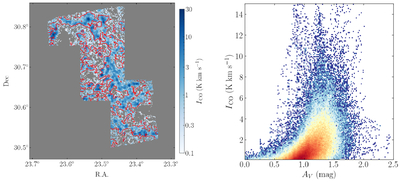
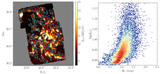
Caption: Figure 6.
Left panel: IRAM CO integrated intensity map (P. Gratier et al. 2010), with red contours indicating the mean AV value as determined in this work. Right panel: a two-dimensional density map (density increases from blue to red) showing the relationship between extinction (AV; x-axis) and integrated CO intensity (ICO; y-axis).
Other Images in This Article
Copyright and Terms & Conditions
© 2026. The Author(s). Published by the American Astronomical Society.
Copyright ©
2026 Astronomy Image Explorer. All Rights Reserved.