Image Details
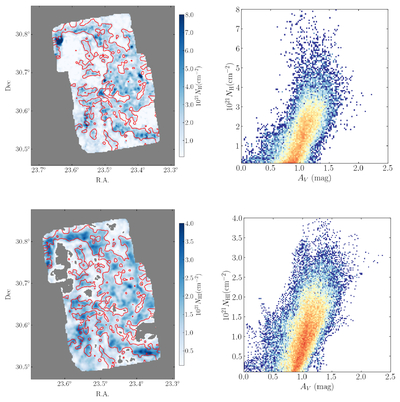
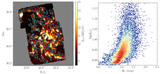
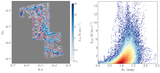
Caption: Figure 5.
Left panels: maps of H (E. Keilmann et al. 2024, upper left), and H I (P. Gratier et al. 2010, lower left) column densities, with red contours indicating the mean AV value as determined in this work. Right panels: pixel-by-pixel comparison between extinction values and gas column densities. For each corresponding gas component, the horizontal axis shows the extinction value in the V band for each pixel determined in this work and the vertical axis shows the column density. The color scale from blue to red represents the number of pixels in each bin (from low to high).
Other Images in This Article
Copyright and Terms & Conditions
© 2026. The Author(s). Published by the American Astronomical Society.
Copyright ©
2026 Astronomy Image Explorer. All Rights Reserved.