Image Details
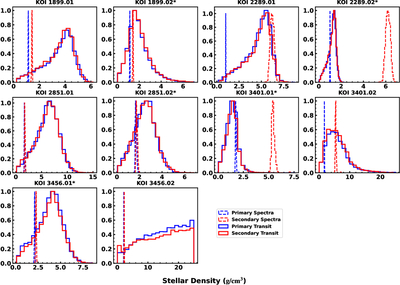
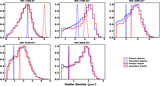
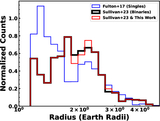
Caption: Figure 7.
The density profiles for the two-planet systems analyzed in this work. The solid blue histograms show the posterior density distribution from transit fitting for the primary star case. The solid red histograms show the same for the secondary star case. The dashed blue and red histograms show the K. Sullivan et al. (2023) spectroscopic density distributions for the primary stars and secondary stars, respectively. Planets with a * in the title are in the radius gap subsample.
Other Images in This Article
Copyright and Terms & Conditions
© 2026. The Author(s). Published by the American Astronomical Society.
Copyright ©
2026 Astronomy Image Explorer. All Rights Reserved.