Image Details
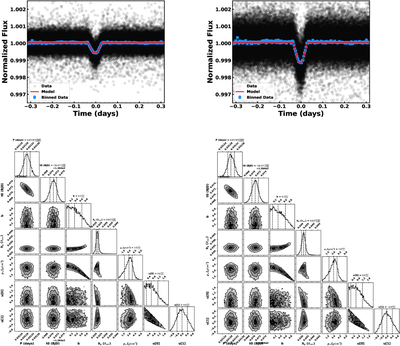
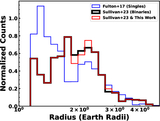
Caption: Figure 4.
The transit-fitting results for KOI-1300.01. The upper right panel shows the phase-folded and contamination-corrected transit lightcurve for the planet’s circumprimary case. The gray circles are the normalized and contamination-corrected flux values. The blue squares are the normalized flux values obtained from binning 800 data points at a time. The red line is the model fit to the data. The lower right panel shows the same information for the circumsecondary case. The upper left panel shows the corner plots from the MCMC sampling in the circumprimary case. The lower left panel shows the corner plots for the circumsecondary case.
Other Images in This Article
Copyright and Terms & Conditions
© 2026. The Author(s). Published by the American Astronomical Society.