Image Details
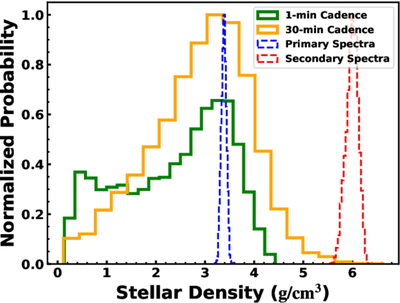
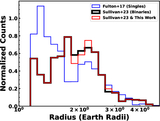
Caption: Figure 5.
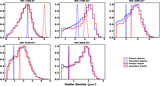
Comparison of the posterior density distributions for KOI-1300.01 when using 30 minute cadence data versus 60 s cadence data. The solid orange histogram shows the transit density distribution using 30 minute cadence data. The solid green histogram shows the transit density distribution using 60 s cadence data. The dashed blue and red histograms show the K. Sullivan et al. (2023) spectroscopic density distributions for the primary star and secondary star, respectively. The results of both are consistent with the planet being circumprimary, but the fast-cadence data yields a broader posterior distribution with a second peak at very low density. This is further discussed in Section 4.2.
Other Images in This Article
Copyright and Terms & Conditions
© 2026. The Author(s). Published by the American Astronomical Society.