Image Details
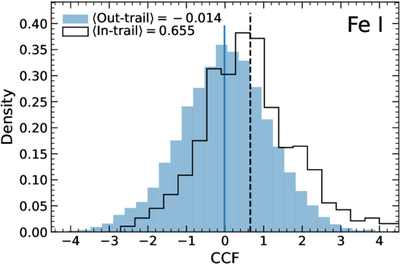
Caption: Figure 8.
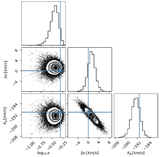
Distributions of CCF(v, t) values obtained using the Fe I model template and by combining the datasets from nights 1 and 2. The filled blue and black outlined distributions are the out-of-trail values and the in-trail values, respectively. The Welch’s t − test rejects the null hypothesis (i.e., that the two samples are drawn from equal-means samples) at a 10σ significance.
Other Images in This Article
Copyright and Terms & Conditions
© 2026. The Author(s). Published by the American Astronomical Society.
Copyright ©
2026 Astronomy Image Explorer. All Rights Reserved.