Image Details
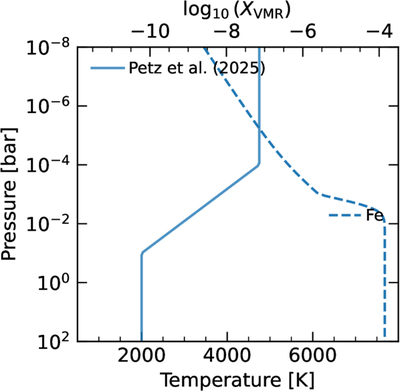
Caption: Figure 3.
MASCARA-5 b’s atmospheric temperature (bottom axis) and Fe I VMR (top axis) adopted for the model emission spectrum. The solid blue line is the PT profile, which is based on that used by P25 to detect Fe I with PEPSI@LBT. The dashed blue line shows the Fe I VMRs calculated using FastChem assuming chemical equilibrium and a stellar metallicity of [M/H] = 0.09.
Other Images in This Article
Copyright and Terms & Conditions
© 2026. The Author(s). Published by the American Astronomical Society.
Copyright ©
2026 Astronomy Image Explorer. All Rights Reserved.