Image Details
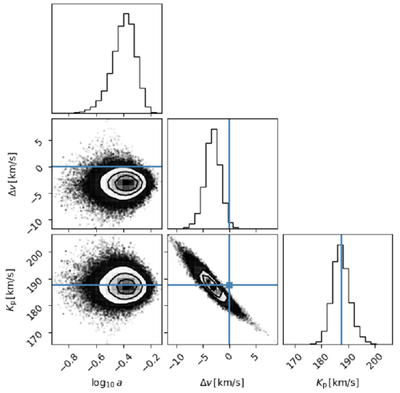
Caption: Figure 7.
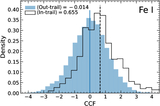
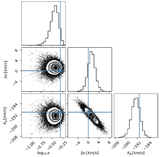
Marginalized posterior distributions obtained from the MCMC sampling analysis using the Fe I forward model. The blue lines indicate the expected values of Kp = 187.6 km s−1 and Δv = 0 km s−1.
Other Images in This Article
Copyright and Terms & Conditions
© 2026. The Author(s). Published by the American Astronomical Society.
Copyright ©
2026 Astronomy Image Explorer. All Rights Reserved.