Image Details
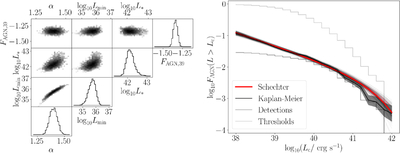
Caption: Figure 8.
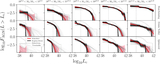
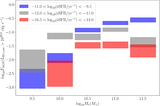
Left panel: bivariate posterior distributions among α, L*, ﹩{L}_{{\rm{\min }}}﹩, and FAGN,39, for the analysis of the entire sample of AGN and AGN nondetections, using L(Hβ)corr. This analysis includes all stellar masses and sSFRs, and we show later that the best-fit parameters depend strongly on those galaxy properties. Right panel: FAGN,Y as a function of ﹩Y={\mathrm{log}}_{10}{L}_{c}﹩ in erg s−1. The thick red line is the mean for the parametric Schechter function estimate, the thin lines are 100 samples of the posterior, and the pink band shows the standard deviation of ﹩{\mathrm{log}}_{10}{F}_{{\rm{AGN}}}﹩ around the mean. The black line is the estimate using E. L. Kaplan & P. Meier (1958), with the gray band showing the 1σ uncertainties using the formula of M. Greenwood (1926). The dark-gray histogram shows the cumulative distribution of AGN detections, and the light-gray histogram shows the cumulative distribution of AGN detection thresholds for nondetections (each normalized to the full sample of detections and nondetections).
Other Images in This Article
Show More
Copyright and Terms & Conditions
© 2026. The Author(s). Published by the American Astronomical Society.