Image Details
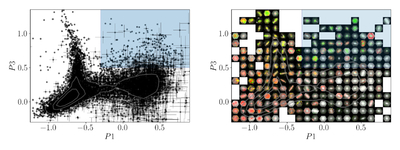
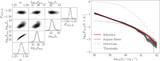
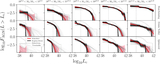
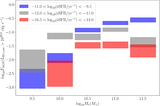
Caption: Figure 2.
Line ratio diagnostic diagram of X. Ji & R. Yan (2020), showing P1 and P3 for MaNGA galaxy central emission-line ratios. The left panel shows the measured values and errors, with the distribution overlaid. The right panel shows one randomly selected galaxy at each location in the plane. The r-band image is shown as a gray scale, with the Hα map contributing to the red channel and the [O III] λ5007 map contributing to the green channel. In both panels, the blue box shows our Seyfert galaxy classification.
Other Images in This Article
Show More
Copyright and Terms & Conditions
© 2026. The Author(s). Published by the American Astronomical Society.
Copyright ©
2026 Astronomy Image Explorer. All Rights Reserved.