Image Details
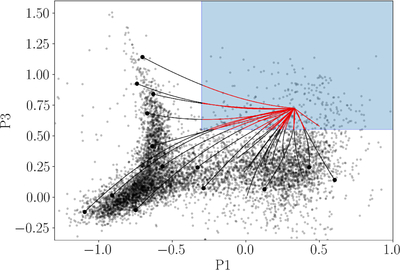
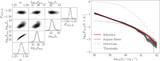
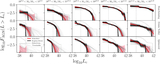
Caption: Figure 3.
Same line ratio diagnostic diagram as in Figure 2, showing the same galaxies, illustrating our determination of L([O III]) detection thresholds for non-Seyfert galaxies. The blue region shows the line ratios for which we define Seyfert galaxies. The small gray points show each galaxy with all five lines detected at at least 2σ significance (error bars are omitted for clarity). The large black points are a random set of non-Seyfert galaxies chosen to span a range of metallicities and ionization spectral shapes (i.e., P3 and P1 values). The lines emanating from each large black point show how the line ratios change with an addition of an AGN component of increasing luminosity. Note that some lines exist without a large black point; those lines are examples for which the host galaxy’s lines are not all detected at 2σ, and the lines start at AGN luminosities that would be necessary to make the lines detectable. The lines are colored red for AGN luminosities high enough to be identified as AGN by our methods and black otherwise.
Other Images in This Article
Show More
Copyright and Terms & Conditions
© 2026. The Author(s). Published by the American Astronomical Society.