Image Details
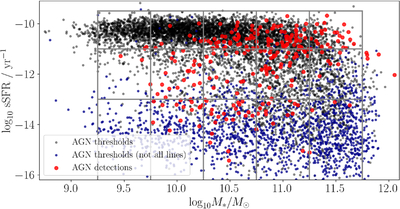
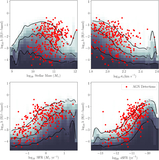
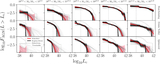
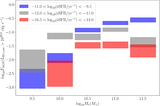
Caption: Figure 1.
Stellar masses and sSFRs for the MaNGA sample used here. Red symbols show galaxies with AGN detections, black symbols show galaxies with AGN detection thresholds (which have all necessary line ratios detected), and blue symbols show galaxies with AGN detection thresholds (without all necessary line ratios detected). The boxes show divisions between stellar mass and sSFR samples we use to study the AGN luminosity and Eddington ratio distribution dependence on galaxy properties.
Other Images in This Article
Show More
Copyright and Terms & Conditions
© 2026. The Author(s). Published by the American Astronomical Society.
Copyright ©
2026 Astronomy Image Explorer. All Rights Reserved.