Image Details
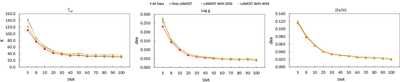
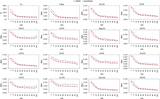
Caption: Figure 6.
Comparison of the MAE for Teff, ﹩\mathrm{log}g﹩, and [Fe/H] under different data inputs across various SNR intervals. Red dots represent results using all data (LAMOST spectra combined with SDSS and WISE photometric data); blue triangles correspond to results using only LAMOST spectra; green squares denote LAMOST spectra with SDSS photometric data; and orange diamonds indicate LAMOST spectra with WISE photometric data.
Other Images in This Article
Copyright and Terms & Conditions
© 2026. The Author(s). Published by the American Astronomical Society.
Copyright ©
2026 Astronomy Image Explorer. All Rights Reserved.