Image Details
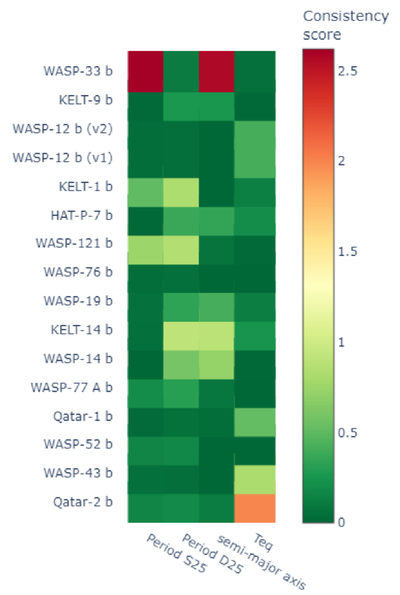
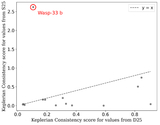
Caption: Figure 3.
A comparison of the consistency scores for three system parameters is presented. Equation (6) was used to compare the periods from S25 with the periods calculated using the Equation (3) (Period S25, in days) and the periods from D25 with those calculated using the Equation (3) (Period D25, in days). Equation (7) was used to compare the semimajor axes from D25 and S25 (semimajor axis, in AU) and the equilibrium temperatures from D25 and S25 (Teq, in K). The corresponding results are reported in Table 5.
Other Images in This Article
Copyright and Terms & Conditions
© 2026. The Author(s). Published by the American Astronomical Society.
Copyright ©
2026 Astronomy Image Explorer. All Rights Reserved.