Image Details
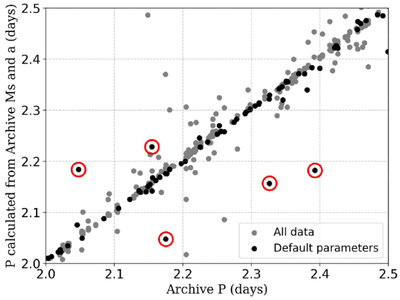
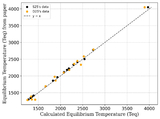
Caption: Figure 7.
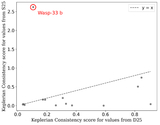
Comparison between the period computed from the Equation (3) and the period given in the NEA (for all data in gray and the default parameters in black). The five outliers highlighted with red circles are discussed in detail below.
Other Images in This Article
Copyright and Terms & Conditions
© 2026. The Author(s). Published by the American Astronomical Society.
Copyright ©
2026 Astronomy Image Explorer. All Rights Reserved.