Image Details
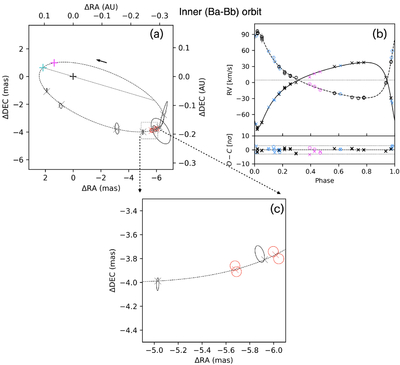
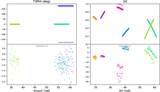
Caption: Figure 2.
Astrometric and spectroscopic orbit of the inner Ba–Bb subsystem in α Psc. (a) Relative astrometry of Ba–Bb, with measurements denoted by 10σ error ellipses; CHARA dual-field measurements obtained in this work are shown in red, while the archival VLTI/GRAVITY measurements are shown in gray. The best-fit orbit of the Bb component is represented by the dashed curve, relative to the Ba component (“+” symbol). The positions on the best-fit orbit for the epochs of our observations are shown as “x” symbols. The magenta and cyan “+” symbols indicate the position of the periastron and the ascending node, respectively. The line of nodes is shown as a gray line. (b) RV curves for Ba and Bb components (solid and dashed curves, respectively), and the corresponding RV measurements (“x” symbols and open circles). The historical RVs taken from the literature are shown in blue, and our RV measurements from the archival NARVAL and newly obtained ARCES spectra are shown in black and magenta, respectively. The horizontal line corresponds to the systemic velocity. The error bars are too small to be seen for most RVs. The lower panel shows the residuals in units of the measurement errors σ, with the dotted lines showing ±3σ. (c) Detail of the astrometric orbit showing the measurements as 3σ error ellipses.
Other Images in This Article
Copyright and Terms & Conditions
© 2026. The Author(s). Published by the American Astronomical Society.