Image Details
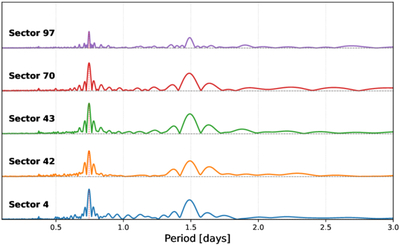
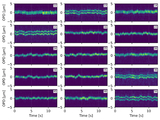
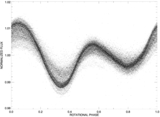
Caption: Figure 11.
Sector-by-sector Lomb–Scargle periodograms for α Psc. Each curve (offset vertically for clarity) corresponds to one TESS sector. All five sectors exhibit a dominant peak at 0.7455d, with a secondary peak at 1.490975 days. No significant power is detected at longer periods.
Other Images in This Article
Copyright and Terms & Conditions
© 2026. The Author(s). Published by the American Astronomical Society.
Copyright ©
2026 Astronomy Image Explorer. All Rights Reserved.