Image Details
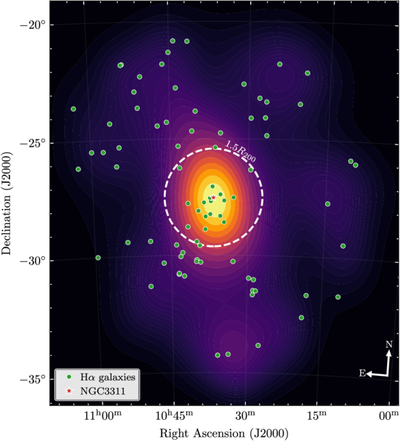
Caption: Figure 7.
Comparison of the sample of 80 galaxies exhibiting Hα emission (green dots) with the galaxy density in the Hydra I region. For the density visualization in the background, only galaxies with photo-z or spec-z between 0.001 and 0.0326 within a clustercentric distance of 5R200 were included. The dashed white circle delimits the 1.5R200 radius, and the red star indicates the position of NGC 3311, the Hydra’s brightest cluster galaxy.
Other Images in This Article
Copyright and Terms & Conditions
© 2026. The Author(s). Published by the American Astronomical Society.
Copyright ©
2026 Astronomy Image Explorer. All Rights Reserved.