Image Details
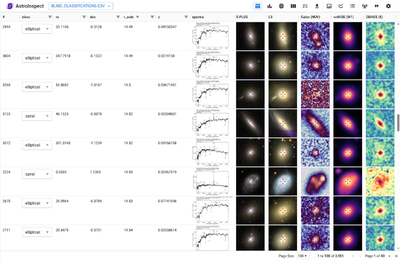
Caption: Figure 1.
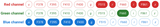
The AstroInspect interface streamlines visual inspection and scientific analysis by integrating spectroscopic, photometric, and imaging data into a single view, allowing “on-the-fly” comparative analyses. The user-uploaded catalog is organized into an interactive tabular interface that merges the input data (e.g., “ra,” “dec,” and “r_auto” columns) with dynamically obtained data from remote services, such as redshift (e.g., “z” column from the SDSS spectroscopic catalog), the spectral energy distribution (“spectra” column), and color images from different surveys (e.g., “S-PLUS,” “LS,” “Galex (NUV),” “unWISE (W1),” and “2MASS (K)” columns, respectively). To support more effective visual assessment, AstroInspect also enables customization of image-rendering parameters, including color stretch functions, color-map selection, and field-of-view adjustments.
Other Images in This Article
Copyright and Terms & Conditions
© 2026. The Author(s). Published by the American Astronomical Society.