Image Details
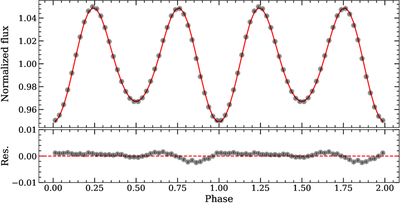
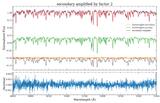
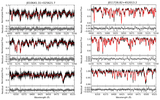
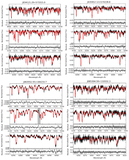
Caption: Figure 7.
PHOEBE’s best-fitting results. In the top panel, the black dots show the rebinned TESS light curve, and the red curve is the best-fitting model. The residuals between the observed data and the model are shown in the bottom panel.
Other Images in This Article
Show More
Copyright and Terms & Conditions
© 2026. The Author(s). Published by the American Astronomical Society.
Copyright ©
2026 Astronomy Image Explorer. All Rights Reserved.