Image Details
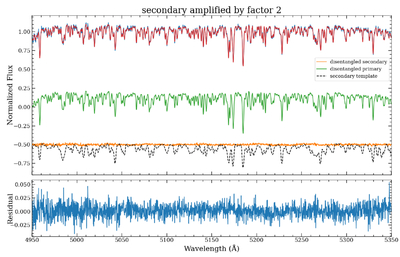
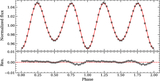
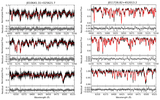
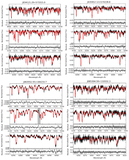
Caption: Figure 6.
Example of spectral disentangling for the target J0341. Top panel: the original observed spectrum (blue), the reconstructed spectrum from the disentangling procedure (red), and the individual spectra of the primary (green) and secondary (orange) components. The secondary spectrum is rescaled by a factor of 2. Stellar template (black dashed line) corresponds to 1.39 M⊙ (Teff = 7017 K, ﹩\mathrm{log}g﹩ = 4.0, ﹩v\sin i=80\,{\rm{km}}\,{{\rm{s}}}^{-1}﹩). Bottom panel: the residuals between the reconstructed and observed spectra, showing that the disentangling reproduces the observed spectrum within the noise level.
Other Images in This Article
Show More
Copyright and Terms & Conditions
© 2026. The Author(s). Published by the American Astronomical Society.