Image Details
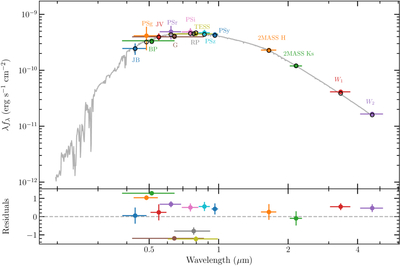
Caption: Figure 3.
SED fitting result for J0341. Top panel: colored circles with error bars indicate observed photometric measurements, while the gray curve represents the best-fit model spectrum derived from the SED fitting. Filter labels are placed adjacent to their corresponding data points. Bottom panel: the residuals of the fit, normalized by the photometric uncertainties.
Other Images in This Article
Show More
Copyright and Terms & Conditions
© 2026. The Author(s). Published by the American Astronomical Society.
Copyright ©
2026 Astronomy Image Explorer. All Rights Reserved.