Image Details
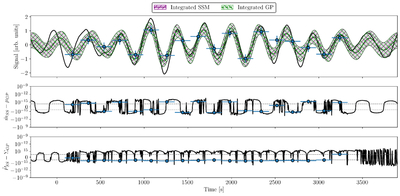
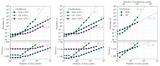
Caption: Figure 2.
Numerical validation that the integrated SSM (purple curve) presented in this work produces the same result as the full integrated GP (green curve) from L26. Top: An example stochastic signal (black curve) from an SHO kernel with a ∼300 s timescale ( Appendix B). The data points are mock measurements of this curve with 180 s exposures and uncertainties of 0.3 (arb. units). Middle: The difference between the conditioned (points) and predicted (black curve) mean of the SSM and GP approach. Bottom: The same for the variances. The horizontal dashed lines show machine epsilon for a single 64 bit floating-point numbers in the dynamic range of the simulated data; this also corresponds to the linear regime of the y-axis symmetric log scale. The two methods generally agree to within an order of magnitude of this level, consistent with the accumulated floating-point error over all the flops in the calculation. Periodicity in the residuals likely stem from the same periodicity in the kernel propagating through the various computations that yield the final mean and variance.
Other Images in This Article
Copyright and Terms & Conditions
© 2026. The Author(s). Published by the American Astronomical Society.