Image Details
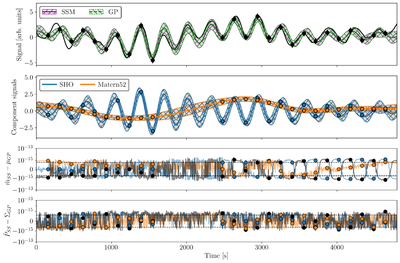
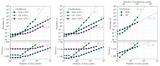
Caption: Figure 1.
Equivalence of linear Gaussian SSMs to GPs. Top: The true signal (in black) is the sum of an SHO and Matérn-5/2 kernel. Synthetic measurements (black points) are noisy samples of this process. The purple “/” band shows the predicted mean and 1σ variance given the data from the SSM method; the green “\” band shows the same for the full GP method. Middle: The same as the top panel but decomposed into each component kernel’s prediction at the test points (filled bands) and at the data (points). Bottom: The bottom two panels show the residuals for the predicted mean and variance from the overall model prediction (black line) and component predictions (blue/orange lines) at the test points, and well as at the data (points), between the SSM method and the full GP method. The horizontal dashed lines denote machine precision for 64 bit floating-point numbers in the dynamic range of the data; In all cases, the difference between smolgp and tinygp is within this level.
Other Images in This Article
Copyright and Terms & Conditions
© 2026. The Author(s). Published by the American Astronomical Society.