Image Details
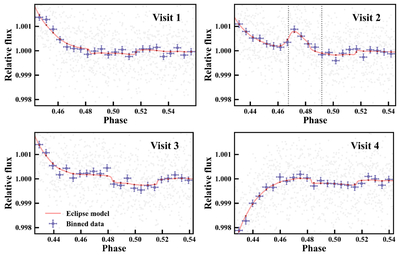
Caption: Figure 3.
MIRI F1500W light curves of GJ 3473 b at secondary eclipse. The raw and binned data are shown in light gray and purple, respectively. The pink curves correspond to the median model predictions from the joint fit, while the brown data points depict the binned model. The model shown here corresponds to the G. Tovar Mendoza et al. (2022) flare model case, as described in Appendix C, used to model the flare-like feature during the second visit. The dotted vertical lines show the nominally masked region in the second visit. Compared to Figure 2, this figure displays the data without correcting for systematics.
Other Images in This Article
Copyright and Terms & Conditions
© 2026. The Author(s). Published by the American Astronomical Society.