Image Details
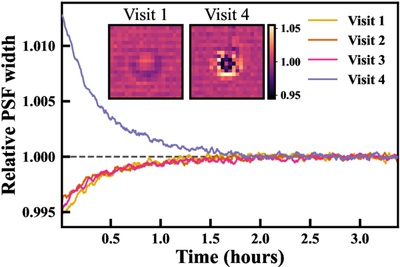
Caption: Figure 1.
Settling behavior of the point-spread function (PSF) across the four visits. Visits 1–3 exhibit an increase in PSF width over time, while visit 4 shows the opposite trend. The two images display the flux ratio between the average of the first 20 integrations and the average of the final quarter of integrations for visits 1 and 4, respectively, prior to background subtraction. In visits 1–3, the central pixels are initially brighter and the surrounding pixels fainter, resulting in a narrow PSF at the start of the observations. In visit 4, the opposite pattern is observed, with a broader initial PSF that narrows over time.
Other Images in This Article
Copyright and Terms & Conditions
© 2026. The Author(s). Published by the American Astronomical Society.