Image Details
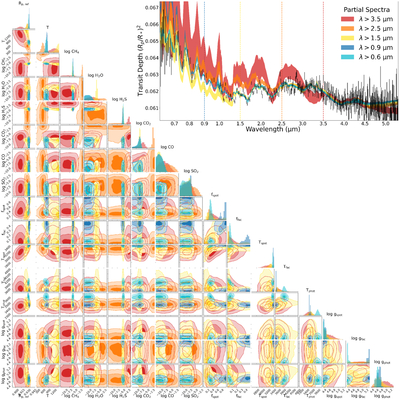
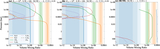
Caption: Figure 23.
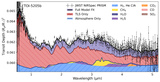
Posterior probability distributions for stellar and planetary parameter (lower left corner of subplots) and 1σ range of fits to the spectrum (upper right panel) from retrievals covering only selected wavelength ranges of the transmission spectra. Colors indicate the short wavelength limit for the different cases. Transmission spectrum envelopes extend shortward of the dashed line corresponding to the respective case wavelength limit to visualize the posterior predictive accuracy of the retrieval constraints on the omitted portion of the data. These predictions illustrate the many possible (mis)interpretations that could emerge from access to limited wavelength data.
Other Images in This Article

Show More
Copyright and Terms & Conditions
© 2026. The Author(s). Published by the American Astronomical Society.