Image Details
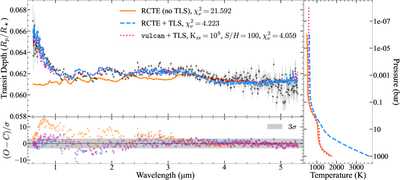
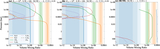
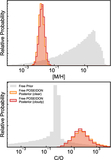
Caption: Figure 3.
Top left: coadded TOI-5205b ExoTiC-JEDI transmission spectrum along with the best-fitting grid-based models assuming equilibrium chemistry (orange line, obtained from PICASO), equilibrium chemistry with TLS (blue-dotted line), or disequilibrium chemistry with TLS (pink-dotted line, obtained from VULCAN). Models with TLS cannot fully replicate the slope at the blue end of the spectrum. Bottom left: the difference between the data and model, scaled by the errors of the data. The ±3σ region is shaded for reference. Right: the pressure–temperature profile for each grid shown in the top left panel.
Other Images in This Article

Show More
Copyright and Terms & Conditions
© 2026. The Author(s). Published by the American Astronomical Society.