Image Details
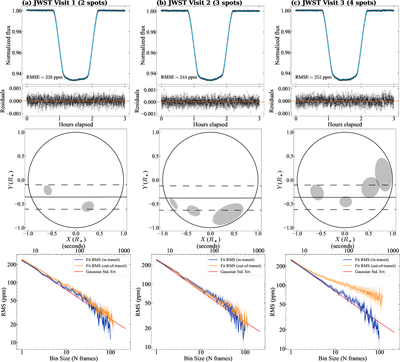
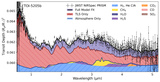
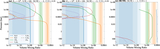
Caption: Figure 1.
Panels (a)–(c) JWST NIRSpec PRISM white light curves produced using ExoTiC-JEDI after binning to a cadence of 5 s. Top row: the data along with the best-fitting model (solid line) along with the residuals to the fit below. Middle row: the stellar surface and the adopted spot configuration. (The transparency of the spots is arbitrary and does not reflect the spot flux ratio.) The solid line indicates the position of the transit chord (center of the planet), and the dashed lines mark the ± Rp from the center of the transit chord. Bottom row: the rms for each visit for in-transit (blue) and out-of-transit (orange) data. The prediction for Gaussian white noise is shown as a red solid line. The residuals to the model fits demonstrate there is no significant time-correlated noise in transit after modeling the spots.
Other Images in This Article
Show More
Copyright and Terms & Conditions
© 2026. The Author(s). Published by the American Astronomical Society.