Image Details
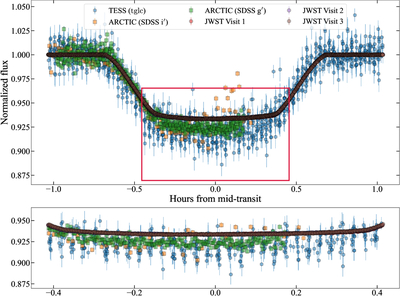
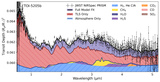
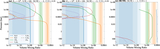
Caption: Figure 16.
Top: a comparison of published ARCTIC photometry from S. Kanodia et al. (2023) with the photometry derived in this work. Bottom: a zoom into the region indicated by a rectangle on the top panel. Both panels display the phase-folded photometry for ARCTIC transits from S. Kanodia et al. (2023), the TESS data derived using a point-spread function to attempt to correct for dilution, and the JWST data. All ARCTIC transits and all TESS transits (before and after JWST observations) are deeper than the white light curves from JWST.
Other Images in This Article

Show More
Copyright and Terms & Conditions
© 2026. The Author(s). Published by the American Astronomical Society.
Copyright ©
2026 Astronomy Image Explorer. All Rights Reserved.