Image Details
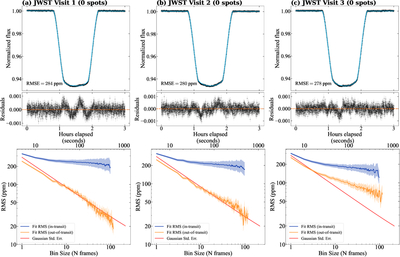
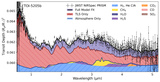
Caption: Figure 13.
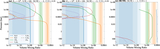
Similar to Figure 1 except displaying the model that includes no spots. Top: for each visit, the best-fitting model is indicated by the solid line with residuals to the fit indicated in the bottom panel. Bottom: the rms for each visit for in-transit (blue) and out-of-transit (orange) data. There is significant structure in transit when the data are not modeled to account for spot-crossing events.
Other Images in This Article

Show More
Copyright and Terms & Conditions
© 2026. The Author(s). Published by the American Astronomical Society.
Copyright ©
2026 Astronomy Image Explorer. All Rights Reserved.