Image Details
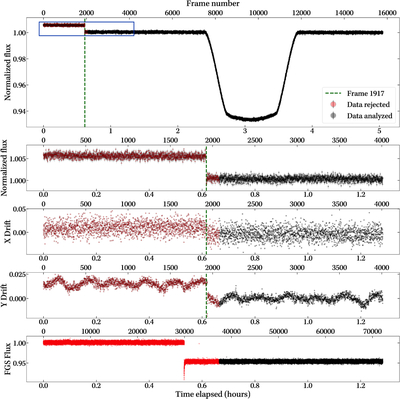
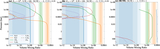
Caption: Figure 12.
Top: the white light curve for observation 17 calculated with ExoTiC-JEDI; the box indicates the region highlighted in the next three subpanels. Bottom four panels: the photometry, shift in the centroid along the dispersion axis (X drift), shift in the centroid along the cross-dispersion axis (Y drift), and the counts in the fine guidance sensor (FGS flux). The discontinuity occurs simultaneously in the position of the trace and the photometry while the FGS flux shows a discontinuity 5 minutes earlier. The dashed vertical line marks integration frame 1917 (the start of the event). The red points indicate the data excised from subsequent analysis (the first 2070 frames), and the black data are the points analyzed in this work.
Other Images in This Article

Show More
Copyright and Terms & Conditions
© 2026. The Author(s). Published by the American Astronomical Society.