Image Details
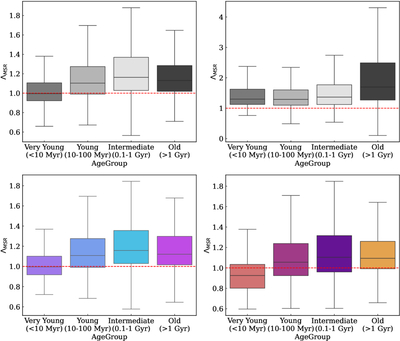
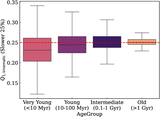
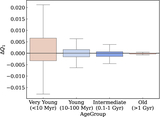
Caption: Figure 5.
Comparison of MST ΛMSR metrics before (top) and after (bottom) Bayesian correction. The corrected values for young clusters cluster around Λ = 1.0 (no segregation).
Other Images in This Article
Copyright and Terms & Conditions
© 2026. The Author(s). Published by the American Astronomical Society.
Copyright ©
2026 Astronomy Image Explorer. All Rights Reserved.