Image Details
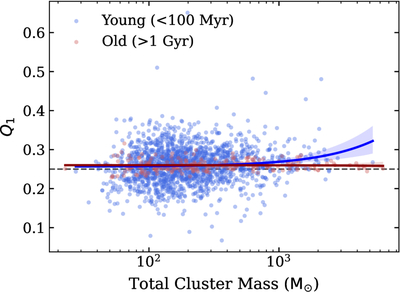
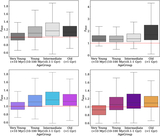
Caption: Figure 3.
Dependence of spatial mass segregation (Q1) on total cluster mass. Blue points represent young clusters (<100 Myr) and red points represent old clusters (>1 Gyr). Lines show the linear regression fits. There is no strong evidence that massive clusters are born more segregated than low-mass clusters, as the vast majority of young clusters hover closely around the random baseline of 0.25. The slight positive tilt in the regression line is an artifact driven by only three extreme outliers (representing <5% of the 66 massive clusters), confirming that primordial segregation is not a universal outcome.
Other Images in This Article
Copyright and Terms & Conditions
© 2026. The Author(s). Published by the American Astronomical Society.
Copyright ©
2026 Astronomy Image Explorer. All Rights Reserved.