Image Details
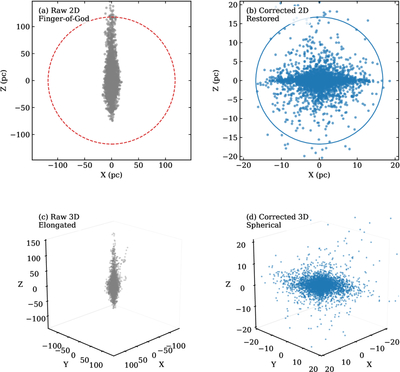
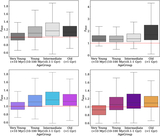
Caption: Figure 1.
Validation of the Bayesian Deconvolution method using NGC 2516 as a case study. (a) and (c) Raw data showing severe “Finger-of-God” elongation along the line of sight (Z-axis). (b) & (d) Corrected data showing the restored spherical structure. This correction is crucial for accurately measuring the 3D radial distribution of stars. The dashed red circle in panel (a) outlines the massive apparent spatial boundary (spanning roughly ± 100 pc) of the raw data inflated by astrometric errors. The solid blue circle in panel (b) represents the compact boundary (∼ ± 15 pc) of the corrected data, successfully restoring the intrinsic spherical symmetry of the cluster. Both panels are plotted with a strict 1:1 physical aspect ratio to reflect the true geometry.
Other Images in This Article
Copyright and Terms & Conditions
© 2026. The Author(s). Published by the American Astronomical Society.