Image Details

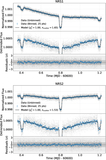
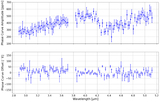
Caption: Figure A2.
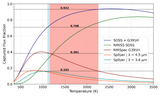
Correlated noise diagnostics for the spectroscopic channel residuals in NRS1 and NRS2. The green curves show the fitted rms of binned residuals, blue curves represent rms values for each spectroscopic channel, while the red line denotes the Gaussian standard error expectation (rms ∝ N−1/2). Both channels track the Gaussian expectation over the bin sizes, even though modest departures appear for NRS1 in several spectroscopic channels nearing the end of the exposure. Dashed vertical lines designating the number of integrations within an eclipse and exposure durations (1 exposure was used for the entire phase curve observation) are shown for reference—demonstrating well-controlled time-correlated noise for the science intervals of interest.
Other Images in This Article
Show More
Copyright and Terms & Conditions
© 2026. The Author(s). Published by the American Astronomical Society.