Image Details
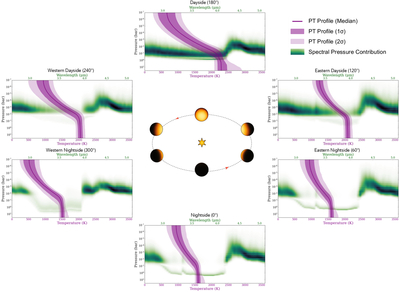
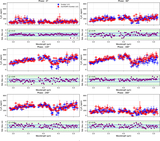
Caption: Figure 3.
Retrieved atmospheric PT profiles and spectral pressure contributions for all six phases. PT profiles are shown in purple, corresponding to the y-axis and bottom x-axis of each subplot. Spectral contributions are shown in green, corresponding to the y-axes and top x-axes of each subplot. Sharing a pressure axis, we are able to analyze how deep into the atmosphere we are probing at each phase. Notably, the intermediary phases exhibit a lower-pressure depth during emission spectroscopy, potentially indicating the presence of high-altitude clouds.
Other Images in This Article
Show More
Copyright and Terms & Conditions
© 2026. The Author(s). Published by the American Astronomical Society.
Copyright ©
2026 Astronomy Image Explorer. All Rights Reserved.